The Sunday Blog
Circular controls – Part 2
After we saw last week in this article how we can display or visualize data in an ergonomic circular form, similar to a gauge or a progress bar, we’ll extend it today into a fully interactive control, close to a (circular) slider.
A question from a last week’s article reader
But before we see how this can easily be done with our Nextion HMI, let’s answer a question which I got: Yes, what we did last week could also have been done by using a series of 11 picture resources which one would attribute to the same picture component, depending on the currently set temperature. But… what if you decide to make the range bigger, for example to have 16 instead of 11 fixed positions? Re-create all the pictures and eating up still more flash memory? Although this would work, it’s not very efficient as one can see. With our solution, it’s just about slightly extending and recalculating our combined sine+cosine look-up table and modifying a few constants in the program.s file. A much more flexible and memory saving approach!
How to add touch functionality (and how not to do it)
Now, let’s move on: To make our “custom control” more interactive, which means allowing to set the temperature (in our example project) not only with the (+) and (-) buttons, but also by touching the corresponding position on the circle, a few arbitrations are necessary. A “pure” mathematician would probably try to solve this by working with reverse sine and cosine to detect an angle, round it to fixed degree steps and then, by further scaling and offsetting get the required integer value. Additional care would be needed for the radius, since you can’t expect your user to touch the circle exactly in a defined distance from the center. I rejected this approach for being too complicated to be efficiently realized in Nextion language.
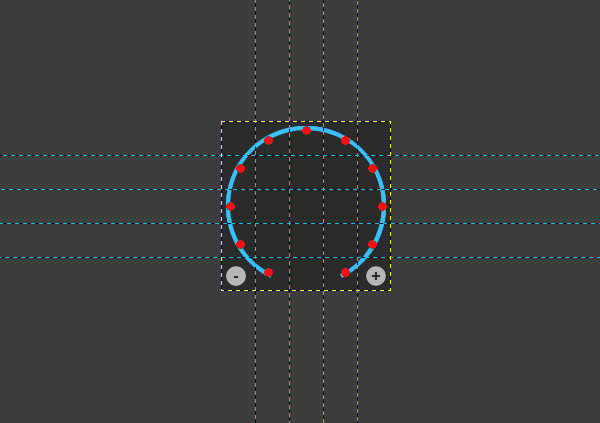
Following the “keep it simple and safe” principle, I decided for a touch raster approach. That means, that I imagine a grid laid over my control as in the picture above. The trick is to optimize the number of squares in a way that none of the squares contains more than a single target dot, and, at the same time, to minimize the number of squares to keep them big enough to be easily hit by touch events. Thus I ended up with a 5 x 5 grid
The next step could be placing Touch hotspot components in the place of the squares containing a target dot. Rejected, because of the lack of flexibility!
Flexibility first!
Again, when modifying the number of target dots, you’d have to resize and move all hotspots before adding new ones. I decided to take the real time touch coordinates (tch0 for x and tch1 for y), subtract the respective x and y coordinates of our component to get coordinates relative tou the upper left corner. Then, since we have 5 squares in each row or column, I’ll divide these relative coordinates by a fifth of the height and width of the component to get each time values between 0 and 4. Multiplying the y-value by 5 and adding the x-value gives me a result between 0 and 24, a kind of field index, where 0 is in the upper left corner, 4 the upper right, 20 the lower left and 24 the lower right corners.
Using known techniques
The last step is to find a way to get the corresponding integer value for each square or cell containing a target spot, and a common “out of range” value for all other cells without interest. Again, as last week, we build a very small pseudo-array with 25 elements in a string, so that the spstr function, called with the field index variable returns either a result between 0 and 10 for the fields containing one of the target spots, and -1 for all others. I called the containing text variable rlt (reverse lookup table) because the common lut (look up table) is already used for the drawing coordinates. Its .txt attribute looks thus like this:
“-1;4;5;6;-1;3;-1;-1;-1;7;2;-1;-1;-1;8;1;-1;-1;-1;9;-1;0;-1;10;-1” and everything is done. The rest is trivial as you can see looking at the code.
Declaring additional variables
The few required additional variables are declared in a single line (bold) in program.s:
//Declare the pseudo-component attributes and helpers:
int c_x_cen, c_y_cen,c_x_plot,c_y_plot,c_intval,c_ulimit
int c_r_plot=8
int c_d_offs=17
int c_maxval=10
int t_scale,t_x_rel,t_y_rel,fld_idx
c_ulimit=c_d_offs+c_maxval
page 0                       //Power on start page 0
Initializing the touch scale factor
The touch scale factor is required to scale down the relative touch coordinates from [0..169] to [0…4] to fit our 5 x 5 grid. This is done with a single additional line in the PostInitialize event of the page (again, in bold):
c_x_cen=p0.w/2+p0.x
c_y_cen=p0.h/2+p0.y
t_scale=p0.w/5
click m1,0
Handling the touch event
is done in the Touch Press event of our container component p0:
// transform touch x coordinate relative to the upper left corner
t_x_rel=tch0-p0.x
// scale into rough steps from 0 to 4
t_x_rel/=t_scale
// transform touch y coordinate relative to the upper left corner
t_y_rel=tch1-p0.y
// scale into rough steps from 0 to 4
t_y_rel/=t_scale
// calculate the field index from 0 (upper left) to 24 (lower right)
fld_idx=5*t_y_rel+t_x_rel
// retrieve the corresponding integer into c_intval
spstr rlt.txt,lval.txt,";",fld_idx
covx lval.txt,c_intval,0,0
// if there is a target spot, update the temperature display, numeric and circular
if(c_intval>=0)
{
  n0.val=c_intval+c_d_offs
  click m1,0
}
And that’s it! These few additional lines improve greatly our “custom control” which we created last week, still following the principle “If you can’t find a suitable control in the Nextion Editor, simply build it yourself”.
Play with it in the Editor and Simulator, upload it on a Nextion HMI, or re-use and adapt this in your own projects, the full code is available here: sblog220417.HMI
Happy Nextioning!