The Sunday Blog
Circular controls – Part 1
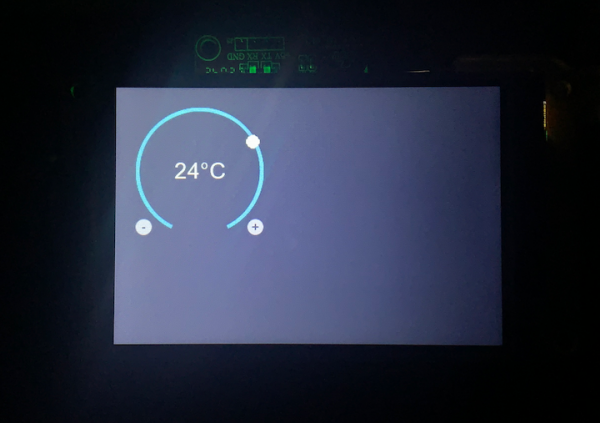
Sometimes, it may happen that you need elements for your GUI but you can’t find an appropriate component in the Nextion Editor. That’s the moment to remember what you’ve already read multiple times in this Sunday Blog over the last two years: “If you don’t have an appropriate component at hands, build it yourself!” And that’s what we’ll do today. In this first step, we want a clock or rotary potentiometer like component which, besides displaying a numeric set value, does also display it for more ergonomic visualisation with a spot on an almost full circle.
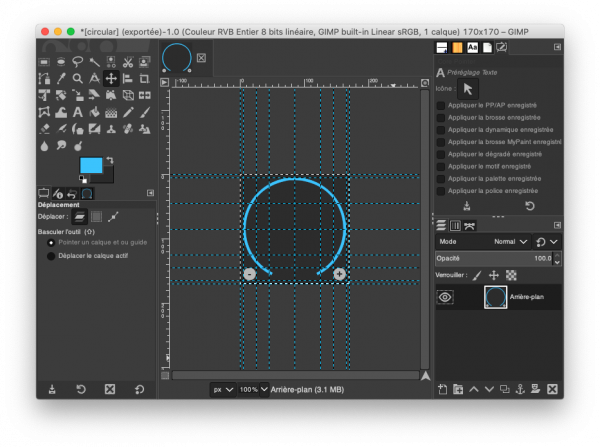
In a first step, I decided to use a picture component as a “container” for what I’m intending to do. This allowed me to save memory and Nextion CPU resources by packing the clear blue arc and the (-) and (+) buttons in a simple jpg which I created with the open source Photoshop clone “The Gimp”. In our example, I choose to build a room temperature “setter” with temperatures going from 17°C to 27°C. There are thus 11 possible values plus the empty position an the bottom which allows to place them similar to the hours of a clock in 30° steps on the circle which greatly simplifies all trigonometric considerations.
The mathematics
Seen from the center of our circle which as an outer radius of 80px and is 8px thick, the center of the spot to display has to move on a circle with a radius of 76px. The 11 y values are thus cos(30°), cos(60°), cos(90°), cos(120°), …, cos(300°), cos(330°) considering that 0° is the empty position at the bottom. Computed, multiplied with the 76px radius, and rounded I got 66, 38, 0, -38, -66, -76, -66, -38, 0, 38, 66 as values to add to the center y coordinate for the 11 different spot positions.
The 11 x-values are -sin(30°), -sin(60°), -sin(90°), -sin(120°), …, -sin(300°), -sin(330°). Again, took the pocket calculator and got -38, -66, -76, -66, -38, 0, 38, 66, 76, 66, 38 as values to add to the center x coordinate for the 11 different spot positions.
Now, I could have used trigonometric identities like sin(-x) = -sin(x), or sin(x) = cos(90°-x) to shorten the above number series at the price of more complex computations in Nextion language, but I decided to keep things simple and safe. Since the sin() and cos() functions are basically identical with a 90° phase shift, we see that our number series are identical when we shift the second by 3 positions (3 * 30° = 90°). Thus, an array with 14 elements [66, 38, 0, -38, -66, -76, -66, -38, 0, 38, 66, 76, 66, 38] allows us to retrieve the 11 y values with the index going from 0 to 10 and the 11 corresponding x values with the index going from 3 to 13.
Looking a few weeks back to the array trick
A few weeks ago, we learnt in this Sunday Blog that we’ve to use a little trick because there are no numeric arrays available: We pack our values into a Text variable component using a separator and can then use the spstr function to extract a value by its index into another Text variable component and use the covx function to retrieve the numeric equivalent.
The rest is simple. We need the center coordinates of our blue circle segment which are half of the width of our picture plus its .x attribute for x and half of the height plus its .y attribute for y. To which we add the values which we retrieve form our look-up array to obtain the center coordinates of our spot to draw with the cirs function.
Coding everything
In program.s, we declare the required variables as follows, setting our maximum array index to 10 because we have 11 positions, and an offset of 17 to translate the index values from 0 to 10 into a displayed temperature of 17°C to 27°C and vice-versa:
program.s
//Declare the pseudo-component attributes and helpers:
int c_x_cen, c_y_cen,c_x_plot,c_y_plot,c_intval,c_ulimit
int c_r_plot=8
int c_d_offs=17
int c_maxval=10
c_ulimit=c_d_offs+c_maxval
page 0                       //Power on start page 0
Then, we place two 20px * 20px hotspots above the visual (-) and (+) buttons to decrease or to increase the temperature setting, each with a little if() clause to prevent going out of range.
m0 Touch Press event
if(n0.val>c_d_offs)
{
  n0.val--
}
and m1 Touch Press event
if(n0.val<c_ulimit)
{
  n0.val++
}
Finally, we need some lines of code to take the temperature value in n0, to detect the position index for the corresponding spot, calculate its drawing coordinates, remove the previously drawer spot and draw the new one. This is done in the m1 (+) button Touch Release event. To double this function for the m0 (-) button without maintaining the identical code twice, the m0 Touch Release event calls simply click m1,0. This separation allows also to set the temperature display from an external MCU (Arduino) by sending “n0.val=23ÿÿÿ” and “click m1,0ÿÿÿ”.
m1 Touch Release event
//Compute the array index
c_intval=n0.val-c_d_offs
//Retrieve and convert rel. y-coordinate and add center coordinate
spstr lut.txt,lval.txt,";",c_intval
covx lval.txt,c_y_plot,0,0
c_y_plot+=c_y_cen
//Retrieve and convert rel. x-coordinate and add center coordinate
spstr lut.txt,lval.txt,";",c_intval+3
covx lval.txt,c_x_plot,0,0
c_x_plot+=c_x_cen
//Refresh the page to clear the old spot
ref page0
doevents
//Draw the new spot at the calculated coordinates
cirs c_x_plot,c_y_plot,c_r_plot,65535
I suggest that you download the project code and resources here sblog220410.HMI and you play with it in the Nextion Editor and Simulator to better understand everything although the code is short and simple. In one of my next articles, we will still add touch functionality, so that you will also be able set the temperature by touching a specific point on the circle. But making a fully functional circular slider requires some more tricks. Stay tuned!
Happy Nextioning!