Feed a waveform component
…from a lookup table
After two theory-loaded blog posts about handling data array-like in strings (Strings, arrays, and the less known sp(lit)str(ing) function and Strings & arrays – continued) which you are highly recommended to read before continuing here, if you haven’t already, it’s big time to see how things work in practice! We’ll use a string variable as a lookup lookup table containing data of one single wave period and add this repeatedly to a waveform component until it’s full.
Before we start…
Please take note of the NEXTION CHRISTMAS SALE, which gives you a $40 discount on all orders above $199. Click here and use the code NEXTIONXMAS !
The waveform component
… is one of the most complex and powerful components which we can add to a Nextion HMI screen. It can display up to 4 curves at a time, but for learning purposes, one single curve will be sufficient. The add command allows to add a single data point to a curve. It takes 3 parameters:
– First is the id of the waveform component. If you are modifying your screen by adding or taking off components, the ids of the components might change. That’s why it is recommended to use the component id attribute (in our example below s0.id) instead of the numeric value (2). Then, you don’t have to worry about reindexing the components, at least as long as you do not rename the waveform.
– Second is the channel number which can take values from 0 to 3. But since we have a single curve and thus have set the waveform’s .ch attribute to 1 (each additional channel eats more RAM…), only 0 is an accepted value for this, since the channel numbering is zero based.
– Third is the y-value of the data point you will add. Accepted values are from 0 to 255. Make sure that you scale your data beforehand to make best use of this range. Although other data ranges can be zoomed from 10% to 1000% with the waveform’s .dis attribute, its not forcibly recommended in all cases because you risk to worsen the effective resolution, similar to a resized picture which might present artifacts afterwards.
The lookup table
Values from 0 to 255 as accepted by the waveform would take 3 bytes or characters (from 000 to 255) in our fixed length lookup table when we use decimal numbers. But since the covx function which we use to convert the extracted string portion back into a number allows also the use of hexadecimal values, we may build our lookup table this way, using 00 to FF for the decimal values from 0 to 255. This way, only 2 bytes or characters are used per data point.
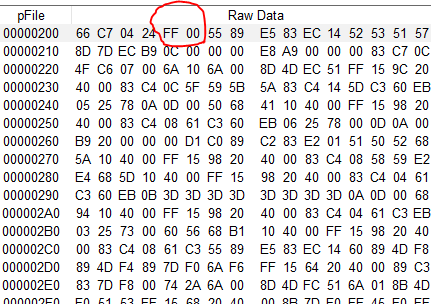
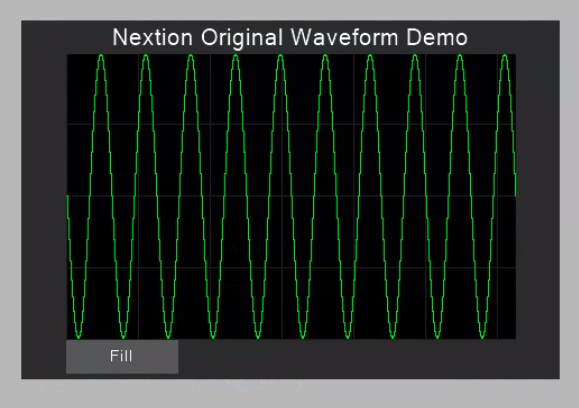
For our example, I choose a sine wave to display and I built the lookup table with 60 points for a full signal period of 360° which makes a total length of 120 characters for the text variable called lookup. It’s .txt attribute is preset as follows:
807366594C41352B2219120C070402010204070C1219222B35414C596673808D9AA7B4C0CBD5DEE7EEF4F9FCFEFFFEFCF9F4EEE7DED5CBC0B4A79A8D
And this contains all the data for a full period of a sine wave. How did I build that string?
I used a spreadsheet calculator app like Excel on a PC or Numbers on a Mac. In the leftmost column, I used the autofill function to get the angle values from 0 to 354° in 6° steps. In the second column, I used a formula to convert the degrees in radians, to compute the sine which would then be between -1 and 1, to scale it up by 127 and to add 128, so that the results would be between 1 and 255, centered around 128, and finally to round the result to integer numbers (0 decimals). In my Numbers app, the formula looks like this: ROUND(128−SIN($A2×PI()÷180)×127;0). In Excel, it should be about the same – I’m sure that you get the idea!
The second column with the computed results has to be formatted to display hexadecimal numbers with two digits. In a last step, you concatenate all the 60 values using the CONCATENATE function in the topmost field of the third column and you are done in seconds. The result looks like this:
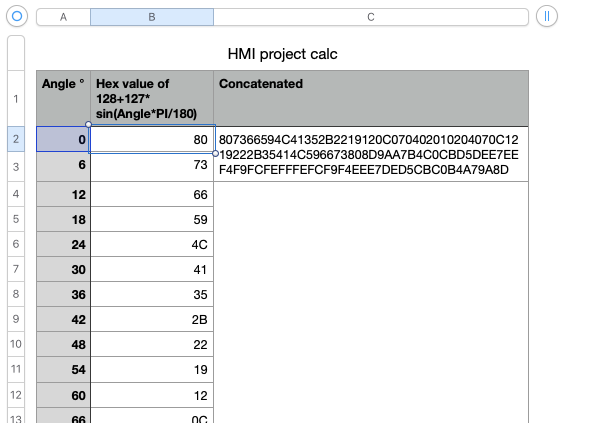
With this, it’s easy to copy/paste the string into the lookup variable’s .txt attribute in the Nextion editor.
Looping through the lookup table and displaying the data
Now, we have 60 data points in a string which is 120 characters long, but the waveform component in our example project is 360 pixels wide and we want all to be filled, if necessary by repeating our iteration through the lookup table. Since we use the substr function to extract our 2 char values from the lookup table, it is clear that the star value (the third parameter) has to be increased in steps of 2, and that the length parameter is always 2. No problem for the first 60 pixels. But at the 61th pixel, we’d try to read beyond the end of our lookup table which is not good. We want it to start over at the beginning. That’s why we use the modulo operator (%) with the lookup table’s txt_maxlen parameter. This way, we can be sure that our code will always behave correctly without modifications, even when we decide to use a lookup table with a different length.
In the same way, we won’t hard code the end point of our for() loop to 360 (the initial width of the waveform component, but we’ll use its .w (width) attribute. Again, this allows us to resize the component without having to modify our code.
In addition to our 120 characters long lookup text variable, we need a second one, called tmp, only 2 characters long to hold the the extracted data portion with substr, before covx converts it back into a numeric value.
In total, we need 3 numeric variables, one for the for() loop to iterate through the width of the waveform component, a second to hold the star value for the substr command by multiplication with 2 and modulo the length of the lookup table as described above, and a third one to hold the current data value which has been extracted by substr from lookup.txt into tmp.txt and converted by covx. To keep things simple, the numeric default variables sys0, sys1, and sys2 were used. And this makes that with a simple TouchPress on the “Fill” button, the following 5-liner does all the work:
for(sys0=0;sys0<s0.w;sys0++)
{
  sys1=sys0*2%page0.lookup.txt_maxl // Repeat lookup until the waveform is full
  substr page0.lookup.txt,page0.tmp.txt,sys1,2 // Extract the lookup value as Hex text
  covx page0.tmp.txt,sys2,0,2 // Convert into number
  add s0.id,0,sys2
}
And we are done. Feel free to download the example .hmi file, to open it with the Nextion editor and to play around with it in the simulator or to upload it on your preferred Nextion HMI display. You are also free to re-use this either in its original or in a modified form in your own projects. Download here: lookup_plot_draw.HMI
Happy Nextioning!
Comments, critics, questions? Please write in the Nextion forum on nextion.tech or send me an email to thierry(at)itead(dot)cc