The Sunday Blog: Graphics programming (once more)
The moving window technique explained
The summary is simple: If you can’t find an appropriate component in the Nextion Editor, you have to write it yourself… My last two blog projects about artificial horizons (here the introduction and here the full project) with Nextion HMI made use of it, twice, in the same way: Both displays, the dynamic sky/earth horizon and the azimuth compass aren’t based on “classic” components, their space on the HMI page is just empty, everything is done by the moving window code.
I got much feedback about this in the different Nextion-related groups on Facebook. People were amazed, but some didn’t understand how I made this work. Thus, I decided to go more into details and do a simple animated FM radio frequency display with still more explanations. At this point, I have to say that I’m very grateful for this kind of feedback! As an old developer horse with 30+ years of experience in coding, it’s sometimes difficult for me to see where my readers could struggle or have difficulties in understanding, especially if these topics appear trivial or self-explaining to me… So, let’s go:
What is the moving window technique?
The moving window technique is used to visualize data in an animated way. For the recent artificial horizon project, we used it to display the elevation angle by displaying a 270 * 270px square whose (bigger or smaller) upper part was clear blue to represent the sky and the (smaller or bigger) lower part was brown to represent the earth. Depending on the elevation angle, the blue part grew and the brown part got smaller and vice-versa. And we used it to display the azimuth compass. Its “needle” did not move, but a defined extracted part of a band, displaying “S – SSW – SW – SWW – W – NWW – NW – NNW – N…(and so on)” moved above the needle, so that the current direction was always centered.
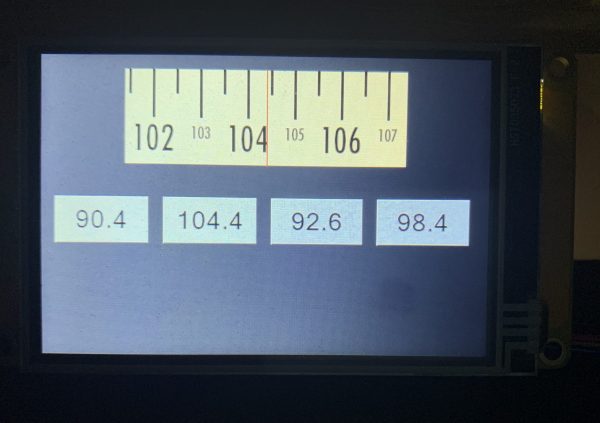
Today, we’ll have a deeper look into the trick, by creating a frequency display for a FM receiver as in the picture above. Instead of showing the full range from 87.5 to 108MHz in a static picture and move the “needle”, we keep the needle in its place and move the frequency scale behind of it. We always show only a part of it which allows for displaying more details. To do so, we use…
The mighty xpic command
The xpic command allows to “crop” a part off a bigger picture resource and to copy it at a defined place on our HMI screen, like in the picture below:
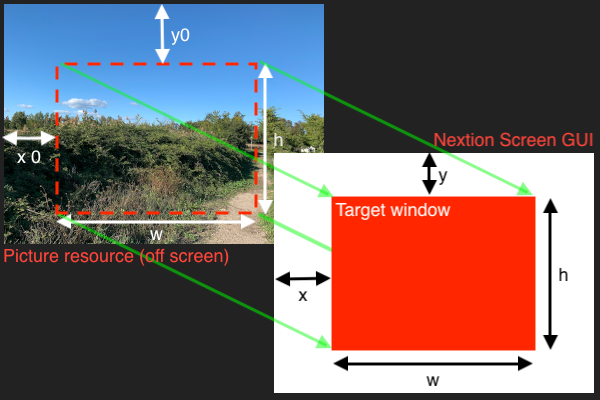
That allows to do impressive things with a single line of code! As for a “classic” GUI component, we need to think and define a few things beforehand: The x- and y-coordinates, the height and the width of the so called target window. That is where our virtual component will be displayed. For our demo project, I decided that my frequency display should be 300px wide and 100px heigh. I wanted it to be horizontally centered on the screen, thus I calculated x to 90px: (480px screen width – 300px component window width) / 2. And I wanted it to be in the upper area of the screen but not glued to the upper border, so I choose y=15.
“Constructing” the picture resource
Since my frequency scale would only move horizontally, the overall height of the picture resource (which we have still to create) would be identical to the target window’s height: 100px, and y0 would be 0. The next design decision which I took was deciding that my 300px wide window should display the center frequency +/- 3MHz. Thus, since 6 full MHz graduations should fit in, I found that the full MHz lines would have to be 50px apart, and the half MHz lines 25px. Now doing some calculus for the full FM range (108 – 87.5 = 20.5MHz), my frequency scale would have a width of 20.5 * 50 = 1025px. Or not?
No, it has to be somewhat wider, because we need also the extreme values, 87.5MHz and 108Mhz to be centered, leaving a blank space of 150px at the right and the left of the frequency scale. Finally, my picture resource which I had to create in a graphics program was required to be 1325 * 100px. The first (short) graduation line for 87.5MHz would then have to be drawn at 150px from the left, followed by alternating long and short lines every 25px until the last long line for 108MHz at 1175px from the left, leaving another 150px wide blank space at the right end.
On the vertical repartition, I decided to have the graduation in the upper half, making thus the long graduations 50px heigh and the short ones 25px. This leaves enough space in the lower half to put the digits. I decided to take a big (36px) for the pair and a smaller (18px) font for still improved and ergonomic readability.
After all this “theoretical” work, assisted by my HP-35S pocket calculator, a pencil and paper, I could launch my graphics software. I use the free open source Gimp, but Adobe Photoshop or Corel Draw will do, too. Beware of MS Paint, the lack of guide lines and layers will still you ways to much time for a worse result!
In the graphics software
Whatever software you use, the proceeding is always the same: Create a new picture with the required dimensions (1325 * 100px) and fill the background layer with your preferred background color. I choose ffddaa. Then, position all the horizontal and vertical guide lines as previously calculated. Add a transparent layer and draw the vertical graduation lines with the alternating lengths. Then, add the small text layers, still using the vertical guide lines and choosing centered text to fill the bottom half of your picture. Save, export as png and you are done. 10 minutes, not more!
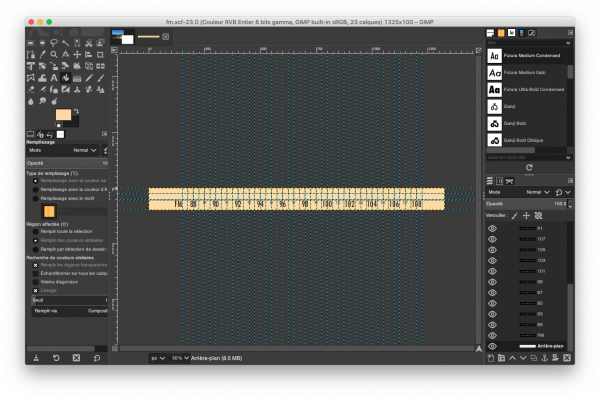
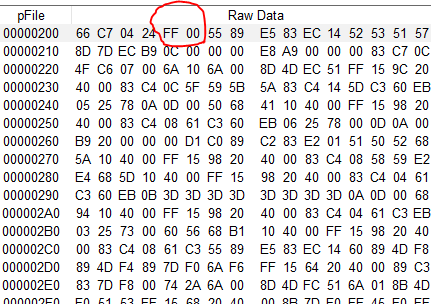
And that’s how the exported png looks like:
![]()
Now, to the Nextion Editor!
In opposite to the “classic” components which allow you to set most properties in the attribute pane of the Nextion Editor, our self-made component requires that we set the static and dynamic properties in code, using variables. I recommend to declare everything global in the program.s tab, so that our component becomes re-usable on multiple pages. So, we need the standard attributes x, y, w, and h as for every component:
// Define the target "window" for the frequency display:
int f_x=90,f_y=15,f_w=300,f_h=100 // all constant
Then, we need the x, y, x1, y1 coordinates for our red vertical scale line. Since it’s vertical, x and x1 are equal, y is the same as our window f_y and y1 is f_y + f_h to fill the full height of our virtual component. A particularity of the program.s file is that you can declare variables and that you can do calculation with variables. But you can’t declare and calculate at the same time. Thus, declare first, calculate later:
// Define everything for the red vertical center line:
int f_lx=240,f_ly,f_ly2
and
// Do some calculation:
f_ly=f_y
f_ly2=f_y+f_h
Now, to the attached picture resource. We have to set the resource id, the x0 (which will be calculated during timer action), y0 (which is always 0, see above) values, and a “step” of 5px for the animation. At each timer run, our timer code will check what f_x0 should be, comparing with the f_x0s set value (which will be set by the timer code after a frequency change). If f_x0 is smaller than the “desired” f_x0s, then f_x0 is incremented by f_step, if f_x0 is bigger than f_x0s, it will be decremented. Note that I initialized f_x0 with -5, an illegal value to force a redraw at startup, where f_x0s is 0:
// Define everything for the source picture:
int f_pic=0,f_y0=0 // all constant
int f_step=5 // animation speed: 5px are 100kHz steps
int f_x0=-5  // variable source window start, from 0 to 1025
int f_x0s=0  // set value for the source window start, calculated from the freq variable
Last, but not least, we need a variable for the frequency to display, called “freq” and which can be set either by Nextion code as the preset keys in our demo project do, or by sending a command string like “freq=1044ÿÿÿ” from an external MCU over serial. Since the Nextion interpreter handles only integer numbers, we have to set the frequency x 10, like 875 for 87.5MHz or 1044 for 104.4MHz. And we need a second variable, freq_p to keep the previously used freq value to see if the frequency was changed since the last timer run:
// "Public" variable:
int freq=875 // set frequency from 875 to 1080
// Define "helpers":
int freq_p=0 // hold the previous freq setting to see if it has changed
And finally, as usual:
// Let's go:
page 0      //Power on start page 0
The timer code
In our demo project, only one single timer, tm0, is required on the page. Its event code is divided into two parts. The first part checks if freq has changed, and, if yes, calculates a new value for f_x0s. Remember, we can have freq values from 875 to 1080 and we have to map these to values from 0 to 1025. This is done with the formula f_x0s = (freq – 875) * 5:
// check if freq has changed and take action:
if(freq!=freq_p)
{
  f_x0s=freq-875*5
  freq_p=freq
}
The second part compares f_x0s and f_x0: If they aren’t equal, the frequency scale must move. That’s the outer if() clause to prevent further time consuming code evaluation if they are equal after an animation ended. The inner if() clause which is only be evaluated if f_x0 and f_x0s are different checks if f_x0s is bigger or smaller than f_x0, increments or decrements accordingly f_x0 by f_step, and redraws our frequency display. First the background, using the xpic function with the new f_x0 value and then the red scale line above:
// if the actual source window is different, move by 1 step (animation)
if(f_x0s!=f_x0)
{
  if(f_x0s<f_x0)
  {
    f_x0-=f_step
  }else
  {
    f_x0+=f_step
  }
  // redraw the target window from modified source
  xpic f_x,f_y,f_w,f_h,f_x0,f_y0,f_pic
  // redraw the center line
  line f_lx,f_ly,f_lx,f_ly2,RED
}
As soon as f_x0 has caught up with f_x0s, and as long as freq does not change, both ifs, the one in the first part and the outer one in the second part fail, the timer code returns without action, leaving enough CPU resources and time for your additional user code.
Preset or not preset
As an example, I added a few “quick and dirty” preset buttons to the page. Each one has a caption, corresponding to the preset frequency, for example 90.4 and a one-liner in the touch press event code, like:
freq=904
Couldn’t do it simpler…
Now, either to compile and upload it to your 3.5″ Basic/Discovery/Enhanced HMI, to play with it in the simulator, or to re-use it in your own projects, you may download the project file here: fm_xpic_demo.HMI
As always, your questions, suggestions, critics, etc. are welcome, either in the Nextion forums on this website, or in one of the Nextion related groups on Facebook.
Happy nextioning!